Yohana Gambarini

Data Analyst
I am passionate about turning raw data into usable knowledge.
I can invest my whole day collecting, cleaning, processing and finally presenting data in a way that people will easily understand!
View My LinkedIn Profile
Welcome to My Data Portfolio
Data Projects
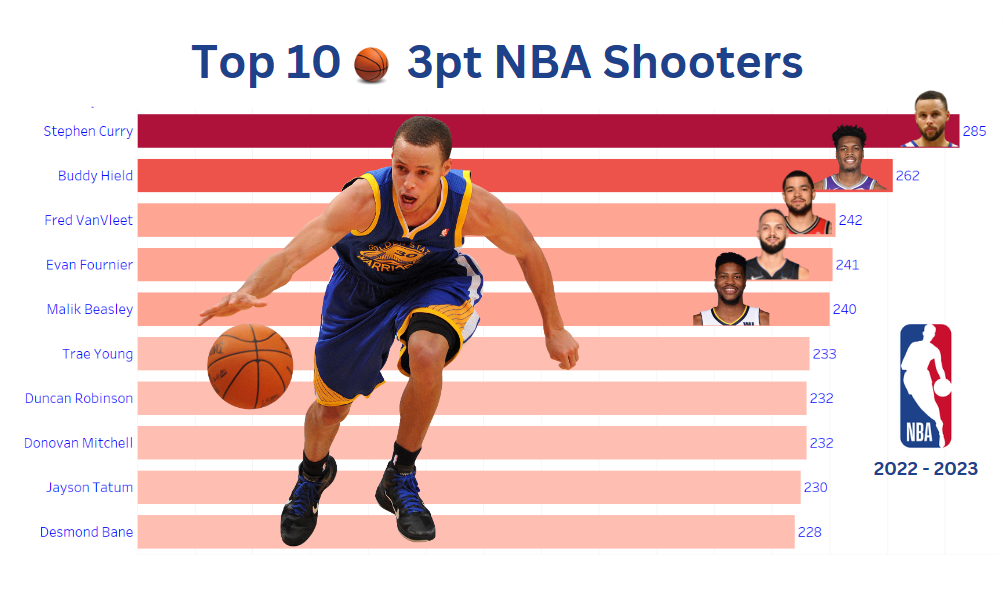
Basktball NBA 2022-2023 Season Project (Tableau)
I delved into data to reveal the untold stories, celebrating the NBA’s magic. From amazing three-pointers to awe-inspiring assists, join me as I spotlight hidden gems, standout plays, and unforgettable moments. Get ready for a statistical adventure in the thrilling world of professional basketball.
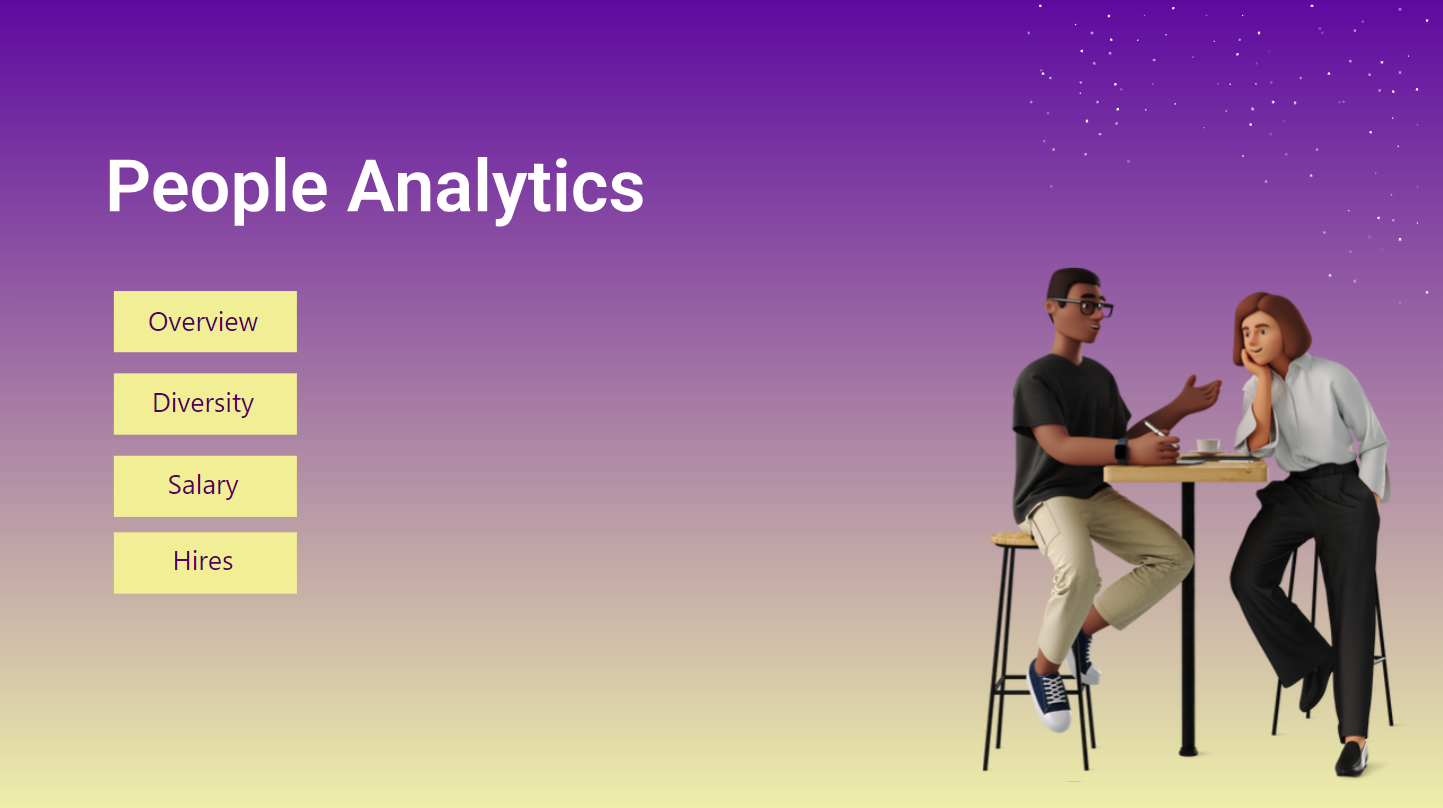
People Analytics Project (Power BI)
For this project, I am using Power BI to explore 1 dataset that represents data from 2006 to 2018. The CSV file revolves around a fictitious company and the core data set contains names, DOBs, age, gender, marital status, date of hire, reasons for termination, department, whether they are active or terminated, position title, pay rate, manager name, performance score, Absences, and Performance Review.
The HealthCare Project (SQL)
In this case study I am using MySQL to explore 2 data datasets that represent data from over 130 hospitals. Among other insights, you will see that I was able to query information like:
-
Distribution of time spent in the hospital.
-
What medical specialties are doing the most number of lab procedures on average?
💵 The Finance Project (SQL)
The Finance Project explores the data to find out the loan situation of countries, but most focused on Tunisia. I develop the project to answer questions like:
-
Show all transactions from the country Tunisia, and the status of their loans.
-
How many total transactions, and how many total transactions per country?
-
Which country has the most loans?
-
What is the average service rate charge for loans given?
-
What was the most expensive project in Tunisia with the highest Original Principle Amount?
🏫 The Education Project (Data Visualization with Tableau)
For this project, I play as a recently hired by the State of Massachusetts to analyze their education data. The Department of Education Superintendent is looking for the following:
-
A report to show the school board the state of the school system
-
How does class size affect college admission?
-
What are the top math schools in the state?
-
What schools are struggling the most?
🍔 The DoorDash Project (Data Analysis w/ Excel)
Overall, the company wants to improve its marketing & wants to see who has purchased following a marketing campaign. I analyze 6 marketing campaigns to deliver insights for the bosses.


